The past ten years has been challenging for the oil & gas industry. Since 2011, the S&P/TSX Capped Energy Index has returned negative 61% relative to a positive 51% return for the broader S&P/TSX Composite Index (as of June 30, 2021). In addition, major international oil & gas companies have retreated from the Canadian market, resulting in significant consolidation and fewer, but larger, companies. At the same time, the rise in environmental, social and governance (ESG) investing is raising questions on the long-term sustainability of the Canadian oil and gas industry and the potential risks associated if the industry is not able to successfully transition to a lower carbon environment.
In this research memorandum, we summarize investor expectations on executive pay within the oil & gas industry, provide insights on the compensation design trends among the 13 constituents of the S&P/TSX Capped Energy Index, and outline considerations for boards and senior management as they continually review and adapt their compensation programs.
INVESTOR EXPECTATIONS
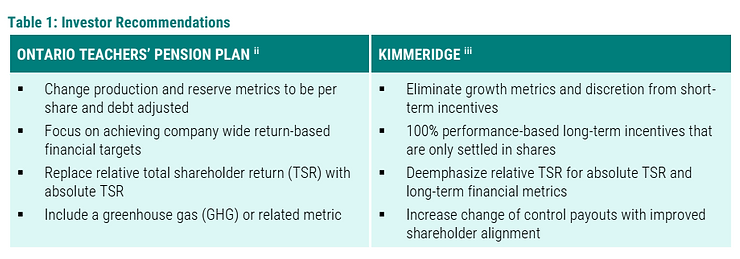
Given market returns, some investor groups have started to raise concerns about the oil & gas industry and its compensation. In 2018, the Ontario Teachers’ Pension Plan released a report on whether management compensation is rewarding the right behaviour. More recently, Kimmeridge released an updated report highlighting key deficiencies in the governance of public exploration & production (E&P) companies in the U.S. The following table summarizes the key recommendations:
In addition to these two reports, the oil & gas industry is also under increasing investor pressure to address climate change and its potential disruption to their long-term sustainability (e.g., stranded assets). This includes a greater emphasis on climate change within executive compensation plans to demonstrate its importance relative to financial and market performance.
MARKET COMPENSATION TRENDS
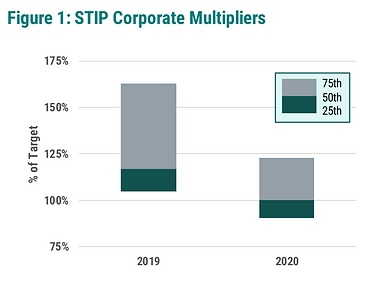
Based on the 13 constituents in the S&P/TSX Capped Energy Index, the reported short-term incentive plan (STIP) corporate performance multipliers in 2019 and 2020 are summarized in Figure 1. In 2020, the 50th percentile payout decreased 17 percentage points to 100% of target with a narrower range above/below 50th percentile. Three companies disclosed the use of board discretion in 2020 to decrease the multiplier (in two cases) or to increase the multiplier (in one case). Most companies maintained the initially approved scorecard and did not make any changes to address the economic impact of the COVID-19 pandemic.
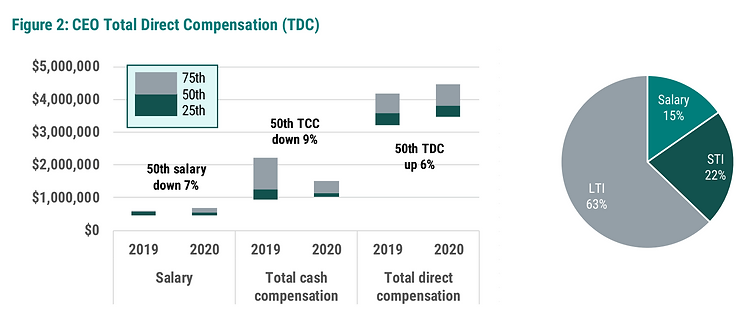
In Figure 2, we summarize the year-over-year changes in actual total direct compensation for CEOs which includes 2020 actual salaries paid (including temporary reductions), actual bonuses for 2020 performance and pre-pandemic long-term incentive awards generally made in early 2020. At the 50th percentile, salaries decreased by 7% because of temporary salary reductions implemented by many of the companies. The lower short-term incentive plan (STIP) corporate multipliers led to a 9% reduction in total cash compensation (TCC), while higher long-term incentive plan (LTIP) awards made in early 2020 resulted in a 6% increase in overall actual total direct compensation (TDC). On average, CEO TDC continues to be majority weighted on long-term incentives (LTI) at 63% with 22% on short-term incentives (STI) and 15% on salary. We note that CEO TDC among the oil & gas companies in this sample is fairly well correlated with revenue or total enterprise value, which is an important consideration when considering these market results.
Below we summarize the key STIP trends observed in 2020 relative to 2019, where appropriate.
Short-term Incentive Plan Trends
Number of measures. Among the market sample, 11 performance measures used, on average, in 2019 and 2020 (ranging from 4 to 19 measures). Average weightings per measure varied as well, from 5% up to 25%, depending on the measure.
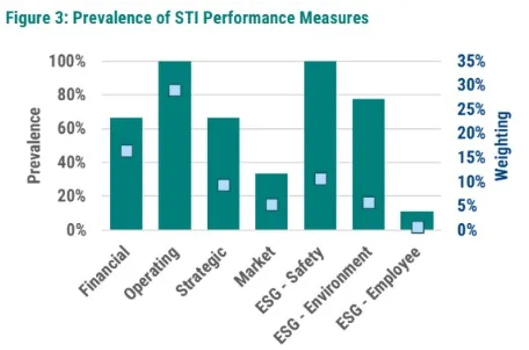
Mix of measures. In Figure 3, we summarize the prevalence of measures (bars) and the weightings of measures (markers). Consistent with broad trends, we saw the greatest increase in prevalence among the various ESG-related metrics in 2020, and would anticipate a continued focus on more strategic ESG metrics such as emissions and diversity going forward.
Average performance scores. Average STI score of 127% of target with most performance measures scored at target or above in 2019 and 2020 (where disclosed). No material differences in average performance scores between financial, operating and ESG metrics.
Long-term Incentive Plan Trends
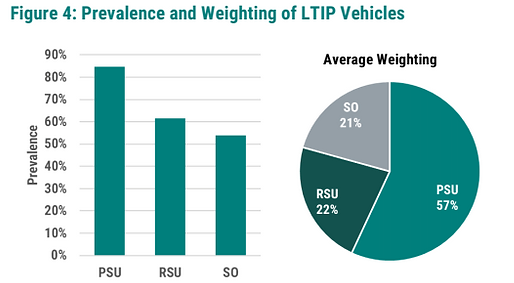
Number of LTIP vehicles. Among the market sample, the number of vehicles ranges from one to three vehicles, with an average of two. Four companies with one vehicle; four with two vehicles and five with three vehicles.
Mix of vehicles. In Figure 4, we summarize the prevalence and weightings of LTIP vehicles. In 2020, we observed a continuing shift away from stock options. Three companies reduced (or eliminated) the weighting on stock options with a corresponding increase on RSUs. While we do not expect companies to make changes solely because of the stock option tax changes made in 2021, we anticipate that companies may take this opportunity to review their overall LTI mix which will likely result in a lower weighting and usage of stock options going forward.
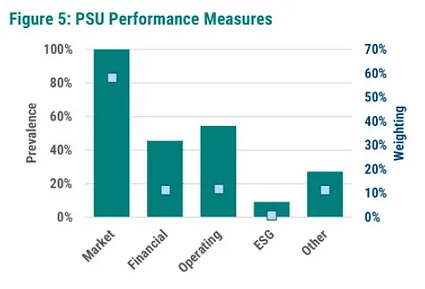
Mix of PSU performance measures. In Figure 5, we summarize the prevalence of measures (bars) and the weightings of measures (markers). One to four measures are used in PSUs with an average of two measures. Market measures (e.g., relative TSR) are the most common used in all PSU plans. A mix of other financial, operating, and strategic measures are used in addition to TSR.
COMPENSATION PRIORITIES (AND AVOIDING DESIGN PITFALLS)
In consideration of investor expectations relative to these market trends, we outline below three potential areas for further discussion and review.
Lack of focus and clarity in STIPs. Many of the STIPs appear to have a lack of focus which can reduce their effectiveness as plan participants are unsure of key strategic priorities and investors may not see a clear link between incentive payouts and performance. Areas of potential concern include:
- Too many metrics – as the number of metrics increase, the relative weighting on each metric reduces – in some cases – this is as low as 2% of the corporate score. This becomes immaterial to an executive’s overall compensation package and does not provide clarity on key strategic priorities
- Lack of clear disclosure – many of the plans appear to be discretionary in nature with assessments made on a basket of measures, but with little to no clarity on how each measure is being assessed
- Weak performance targets – as illustrated by average performance scores that tend to be above target v. a normal distribution where the likelihood of achieving target is closer to the 50th percentile through the commodity cycle
Short-term nature of long-term incentives. As companies continue to move away from stock options (e.g., three companies reduced the weighting on stock options in 2020), the average expected life of the long-term incentive portfolio decreases given that PSUs and RSUs vest within a three-year period (v. stock options being exercised over a four-to-five-year period).
While there are annual awards of PSUs and RSUs resulting in overlapping vesting periods that effectively go beyond three years, this remains a relatively short period of time when compared to strategic decisions being made on reserves and production.
One approach, used by a couple companies, is to allow for the settlement of RSUs through a treasury-backed share reserve. This provides many benefits for both participants and the company, including:
- Vesting beyond three years to align more closely with strategic planning and capital decisions
- Flexibility for Canadian participants to time the settlement of the RSUs like the exercise of a stock option (i.e., ability to choose when to exercise vested RSUs prior to the expiry)
- Continued vesting for good leavers (e.g., retirees) so that the RSUs provide share price alignment post-employment
- Real share ownership supports greater alignment with shareholders
Treasury-settled RSUs can also be an effective vehicle for a separate incentive award tied to very long-term carbon reduction targets (e.g., 30% by 2030), with vesting subject to the achievement of that target.
Too many non-market measures in PSUs. Many investors have cited concerns with a reliance on relative TSR compared against a self-selected industry peer group which may not account for industry subpar performance relative to a broader market. This has also been amplified by the reduction in the use of stock options which are implicitly based on absolute share price appreciation, providing a good balance between relative and absolute performance. Finally, companies have been adding non-market measures to PSUs, but these measures have the potential to create a disconnect with absolute market returns. Areas of potential concern include:
- Use of operating and/or strategic measures that might be qualitative in nature and/or disconnected from commodity price exposure (i.e., not correlated with long-term value creation)
- Lack of clarity on the definition of these non-market measures and their underlying performance targets to truly understand how performance is adjudicated and trending over time, as illustrated by payouts that tend to track above target
- Disconnects between relative and absolute incentive awards where strong relative performance may occur in periods of weak absolute returns and/or a lack of commodity price sensitivity which more closely aligns with the shareholder experience
In summary, we believe that there is no one size fits all solution when it comes to effective executive compensation design as each company’s strategy and priorities differ. These differences need to be reflected in a tailored and simple compensation approach. This market review indicates that there might be a misalignment between compensation designs and investor expectations, and between long-term value creation and incentive payouts. To test your program alignment, we would suggest an analytical review of the pay-for-performance relationship (e.g., reviewing realizable/realized compensation relative to performance on both an absolute and relative basis over a multi-year period). These analytics can be useful tools to test effectiveness for communication to plan participants and for disclosure to investors.
[i] Constituents include Arc Resources, Canadian Natural Resources, Crescent Point Energy, Cenovus Energy, Enerplus, Imperial Oil, Meg Energy, Prairiesky Royalty, Parex Resources, Suncor Energy, Tourmaline Oil, Vermilion Energy, Whitecap Resources
[ii] Ontario Teachers’ Pension Plan – Oil & Gas Exploration & Production – Is Management Compensation Rewarding the Right Behavior?
[iii] Kimmeridge – Executive Compensation: The Good, the Bad and the Ugly
Interested in learning more about working with Southlea? Click here
Click to view our Service Offerings