The following summarizes market trends among a sample of “early filers” including eighteen S&P/TSX 60 companies (who filed by March 30, 2026) to highlight expected trends through this year’s proxy season. As illustrated in Figure 1, Canadian companies experienced exceptionally strong market performance in 2025. The S&P/TSX Composite surged approximately 29% on a total return basis. Canada’s heavy weighting toward financials, materials, and energy proved favorable, with the materials sector leading the way, as metals prices reached record highs. Despite U.S. tariff volatility early in the year, markets powered through uncertainty, and strong corporate earnings translated into meaningfully higher incentive payouts.
Figure 1: S&P/TSX Performance Summary

Key Takeaways
- Exceptional market performance in 2025: 2025 TSR for the median S&P/TSX Composite company was 29%, well above the 14% total return in 2024. The materials sector led gains, followed by financials and energy.
- Salaries remain relatively flat: The median CEO salary was essentially flat between 2024 and 2025 at approximately $1.45M (+0.7%), following a 7% increase from 2023 to 2024. The 75th percentile rose modestly (+2%). CFO median salary was flat at $750K, though the 75th percentile jumped 11% from 2024 to 2025.
- Corporate performance factors surging, PSU payouts declining: The median corporate performance score increased 14 points between 2024 and 2025 to 1.16x target, aligned with the strong financial and market performance observed across the TSX. PSU payout factors, however, continued to decline, from 1.15x in 2023 to 1.04x in 2024 and now 1.00x at median in 2025. The range of payout factors continued to be substantial.
- Actual total cash rising sharply: CEO actual total cash at median increased 13% between 2024 and 2025 (to $4.5M), driven by elevated corporate performance scores translating into higher bonus payouts. CFO actual total cash increased 22% at median to $1.85M.
- Meaningful increases to actual total direct compensation: ATDC (salary + actual bonus + long-term incentives) increased 19% at median between 2024 and 2025 for CEOs (to $16.03M) and 13% for CFOs (to $4.65M). The CEO 75th percentile also rose 17% to $22.3M. The widening range between the 50th and 75th percentiles observed in prior years continues, consistent with growing competitive pressure from North American talent markets and the effect of a weaker CAD:USD exchange rate.
- Consistent pay mix, modest shift toward LTIP: Overall pay mix and LTI vehicle mix remain largely stable year-over-year. LTI continues to comprise approximately 72% of CEO pay and 60% of CFO pay. Within LTI, PSUs remain the dominant vehicle at approximately 67% for CEOs and 61% for CFOs. A slight increase in RSU weighting is emerging (15% for CEOs, up from 11% in 2023; 16% for CFOs, up from 14%), which may reflect boards seeking to provide more stable long-term value retention in uncertain environments.
Market Compensation Trends
The following trends are based on the same incumbent in fiscal years 2023, 2024, and 2025, and represent actual compensation disclosed over the past three years, including salaries, actual bonuses, and grant values of long-term incentives (all dollar values are reported in CAD[1]).
[1]Where values are disclosed in USD, amounts have been converted to CAD using the Bank of Canada average exchange rate for each year (2023: USD/CAD 1.3497; 2024: 1.3698; 2025: 1.3978)
Figure 2: Salaries (CAD$000s)
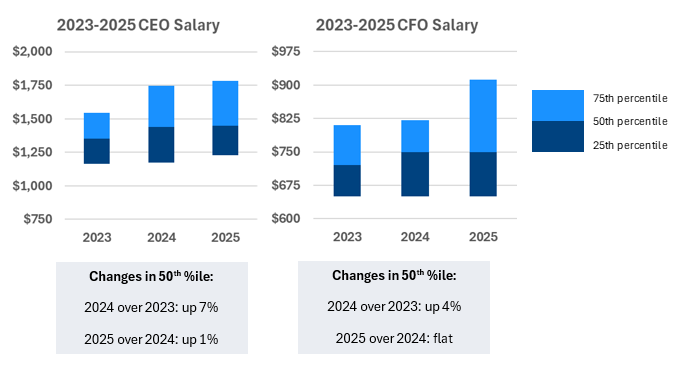
As illustrated in Figure 2, CEO salaries at median were essentially flat between 2024 and 2025 at approximately $1.45M, following a 7% increase between 2023 and 2024. The 75th percentile increased modestly at 2% (following a 13% increase the prior year). CFO salaries at median remained flat at $750K between 2024 and 2025, but the 75th percentile rose 11% to $912K (notable from the 1% increase the prior year).
Figure 3: Performance Factors (as a % of target)
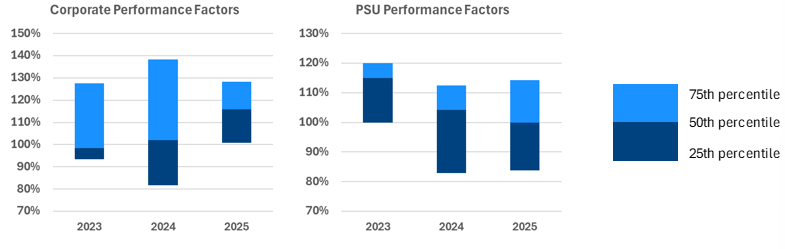
Corporate performance factors represent a significant portion of short-term incentives awarded to named executive officers, making the corporate performance factor a large driver of actual bonus paid and resulting total cash.
As illustrated in Figure 3, the median corporate performance score increased 14 points between 2024 and 2025 (from 1.02x to 1.16x), reflecting the exceptionally strong market and financial performance observed across the Canadian market. This is a notable jump from the approximately 4 percentage point increase between 2023 and 2024. At the 75th percentile, the corporate score reached 1.28x in 2025, compared to 1.38x in 2024, suggesting that while median performance improved significantly, the range narrowed somewhat.
PSU payout factors continued to decline, reaching 1.00x at median in 2025 (from 1.04x in 2024 and 1.15x in 2023).
Figure 4: Actual Total Cash (ATC) (CAD$000s)
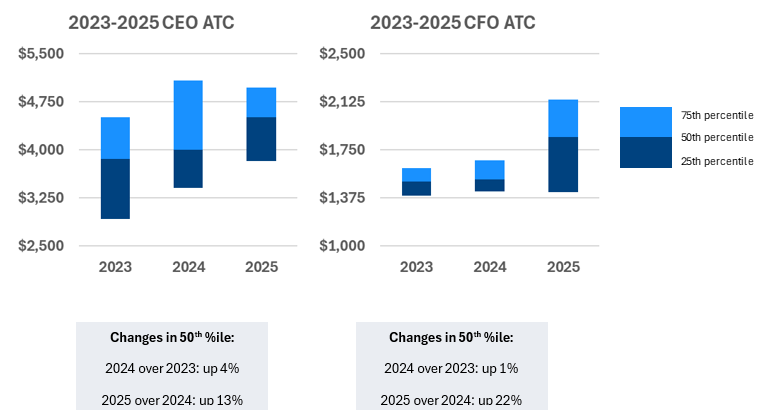
Strong corporate performance resulted in meaningful increases to actual total cash year-over-year. As illustrated in Figure 4, CEO actual total cash increased 13% at median between 2024 and 2025 (to $4.50M), a sharp acceleration from the 4% increase observed the prior year. The increase was driven primarily by elevated corporate performance scores, which amplified bonus payouts. CFO actual total cash increased 22% at median to $1.85M, a substantial jump from the 1% increase between 2023 and 2024.
Figure 5: Actual Total Direct Compensation (ATDC) (CAD$000)
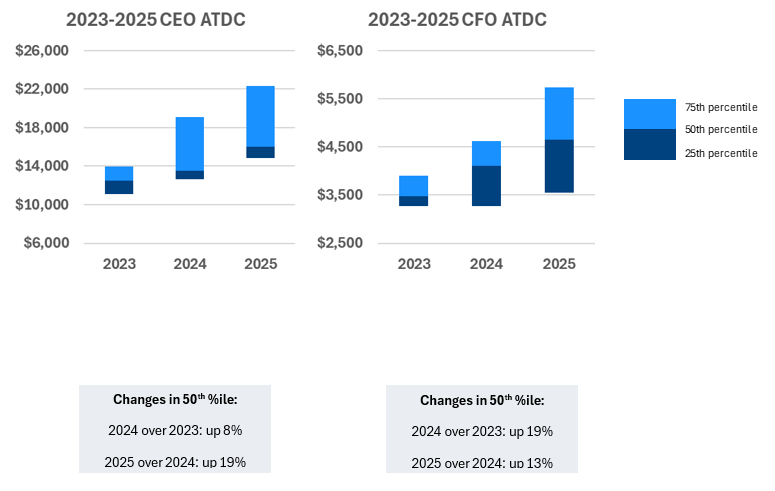
Actual total direct compensation (ATDC = ATC + long-term incentives) also increased meaningfully between 2024 and 2025, as shown in Figure 5. Among CEOs, ATDC increased 19% at median to $16.03M and 17% at the 75th percentile to $22.3M. The widening range between the 50th and 75th percentiles observed in prior years continued, as the 75th percentile has increased 62% from 2023 to 2025 (from $13.9M to $22.3M) — consistent with increasing competitive pressure for senior executives in North American talent markets and the impact of the CAD:USD exchange rate on compensation benchmarking. These phenomena are discussed further in Southlea’s recently published article: Tackling Currency Challenges in Canadian Executive Compensation. CFO ATDC at median increased 13% to $4.65M, with the 75th percentile rising 24% to $5.73M.
Figure 6: CEO and CFO Pay Mix
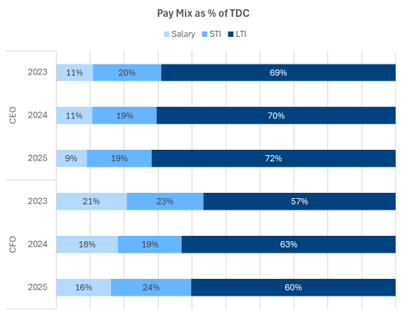
Figure 6 summarizes the overall pay mix for CEOs and CFOs at the 50th percentile. Long-term incentives (LTI) remain the most heavily weighted component at approximately 72% of pay mix for CEOs and 60% for CFOs, respectively. Short-term incentives (STI) comprise 19% for CEOs and 24% for CFOs. The weights are largely consistent year-over-year, with a slight shift for CFOs toward LTI (from 57% in 2023 to 60% in 2025) driven by increasing LTI grant values.
Figure 7: CEO and CFO LTI Mix
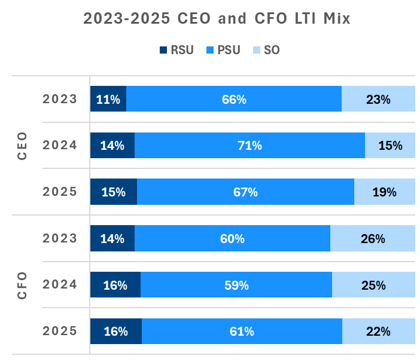
As summarized in Figure 7, the average mix of long-term incentives over time is broadly consistent. LTI is mainly delivered in performance share units (PSUs), with more mixed use of restricted share units (RSUs) and stock options (SOs). Notable emerging trends include a gradual increase in RSU allocation for both CEOs (from 11% in 2023 to 15% in 2025) and CFOs (from 14% in 2023 to 16% in 2025), with corresponding decreases in stock option weighting. This is consistent with boards seeking to balance performance alignment with retention incentives in an environment of elevated market uncertainty.
2026 Expectations
Southlea’s top five predictions for 2026 include customized executive compensation packages, individual investors becoming more influential, distinct compensation for technology roles, more emphasis on entry and exit pay, and debates continuing over one-time awards.
Aligned with these predictions, we expect these preliminary results to apply across the broader market, resulting in continued increases to pay levels, particularly in LTIP. As Canadian companies increasingly compete for executive talent on a North American basis, we expect the adoption of higher LTIP grants to continue to accelerate. Higher weight on LTIP also creates pay-for-performance alignment and adheres to shareholder preferences and proxy advisor guidance.
In reviewing the disclosure for these early filers, we observe the following examples of changes to executive compensation for 2026:
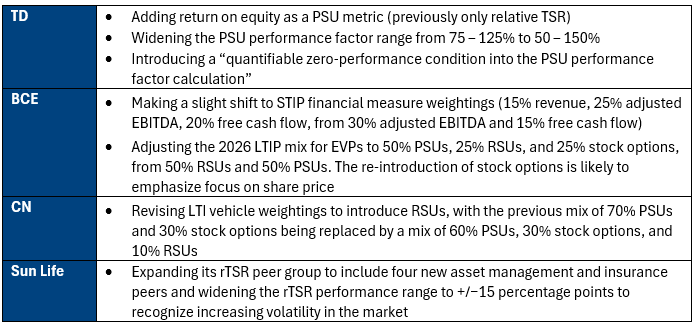
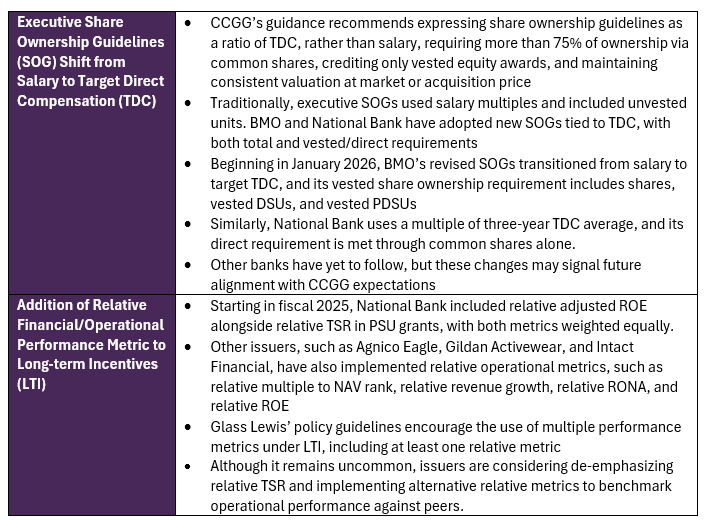
From a governance perspective, we note the following two major changes to disclosure for 2026: