As the Canadian energy sector [1] continues to navigate a landscape of market consolidation, executive compensation has seen a modest uptick, driven largely by rising incentive levels.
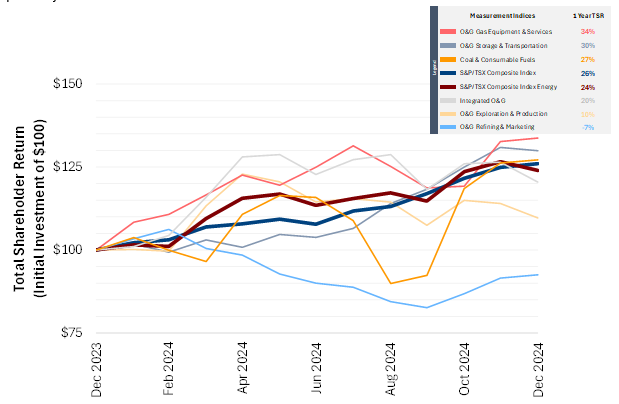
The compensation outcomes for 2024 were shaped by robust financial performance. Median revenue growth for the year stood at 3%, while EBITDA remained relatively stable at -1%. Total Shareholder Return (TSR) demonstrated considerable variation across energy sub-sectors: the overall energy index increased by 24% during 2024, with refining and marketing declining by 7%, whereas equipment and services experienced a notable rise of 34%. Our sample of S&P/TSX Composite Energy companies reported enterprise values ranging from $2.5 billion to $16 billion, representing the 25th to 75th percentile, respectively
In this analysis, we reviewed CEOs and CFOs who were in role for the past two fiscal years. Doing so allows us to isolate changes to increasing compensation, rather than an evolving mix of incumbents and / or companies in the sample. We reviewed results from the energy sector in aggregate, rather than reviewing subsectors, as the sample size of most subsectors was insufficient to draw implications from.
[1]The energy sample consists of 40 companies from the S&P / TSX Composite Index classified under the energy sector at the time of analysis
Salaries and Incentives Continue to Climb
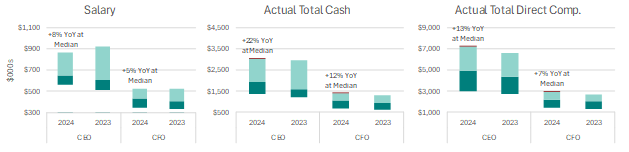
Base salaries for top executives increased moderately, with the 50th percentile of CEO and CFO compensation increasing by 8% and 5% respectively. The median salary increase was 4-5%, with 25% of incumbent CEOs receiving an increase of 10% or greater and 18% of incumbents not receiving an increase.
Actual Total Cash Compensation and Actual Total Direct Compensation both surged by 13% for incumbent CEOs and 7-8% for CFOs, reflecting a continued shift to incentives as the primary driver of compensation increases.
Bonus Payouts Exceed Targets
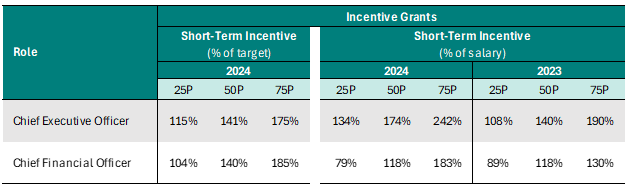
At median, as a percent of salary, actual STI payouts (as a percentage of salary) increased from 140% in 2023 to 174% in 2024, while, for the CEO, the median payout was 141% of target.
Pay Mix: Long-Term Focus
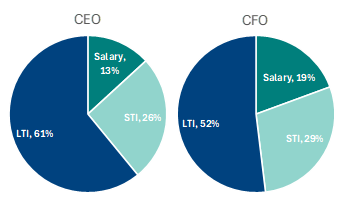
The composition of executive pay was steady in 2024, with CEO compensation broken down as 13% salary, 26% short-term incentives, and 61% long-term incentives. CFO compensation continues to be more fixed than CEO, breaking down as 19% salary, 29% short-term incentives, and 52% long-term incentives. Typically, we see a correlation between higher pay levels and more variable pay.
Long-Term Incentive Mix
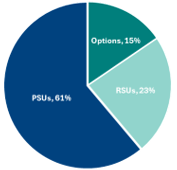
In the Long-Term Incentive (LTI), Performance Share Units (PSUs) continue to take center stage, reflecting 61% of the LTI, with Restricted Share Units (RSUs) and Stock Options reflecting the remaining 23% and Within PSUs, 74% of companies use Total Shareholder Return (TSR) as a key metric. Other common measures include ESG metrics (28%), strategic objectives (26%), and cash flow (15%). Most companies employ multiple metrics, with only two relying solely on TSR. Southlea recommends diversifying metrics to enhance measurement robustness and avoid unintended effects. While Relative TSR aims to assess management performance, its limitations—such as differences in peer operating and risk profiles—mean diversification remains important.
Reviewing the prevalence of vehicles in companies’ LTIPs, PSUs are used at 75% of companies, RSUs are used in 60% of plans, while Stock Options are used in 35% of LTIP plans.

What This Means for the Energy Sector
As consolidation continues across Canada’s energy industry, pay rates are expected to climb. One trend worth watching is how Canadian firms are comparing executive compensation to their U.S. counterparts, whose currency-adjusted packages are often higher—this could drive further increases in Canada. The shift towards RSUs and PSUs persists, with plans for PSUs being continually adjusted. Given the challenges of setting multi-year PSU targets, some companies are showing interest in time-based equity awards like RSUs, featuring longer vesting periods (such as five years) and post-exercise holding requirements. These approaches provide stronger, long-term alignment with shareholders and simplify matters compared to PSUs. Such strategies may be particularly well-suited for energy businesses that have extended capital cycles and experience significant price fluctuations. Additionally, the use of absolute shareholder returns as a reward metric is gaining traction among energy producers, moving away from past focuses on growth.
About The Author
Tanner Woods, Senior Analyst
Tanner is a Senior Analyst at Southlea Group.
He has two years of experience providing analytical support on executive and broad-based compensation projects.
He has experience supporting companies with a broad amount of compensation initiatives, including broad-based structure development, peer group development and competitive benchmarking of board members and executives.
Tanner has experience working across various sectors, including oil & gas, mining and asset management.
Tanner holds a Bachelor of Arts, Honours Business Administration with distinction from the Ivey Business School at Western University and the chartered financial analyst (CFA) designation.