Executive Summary
Total direct compensation (TDC)
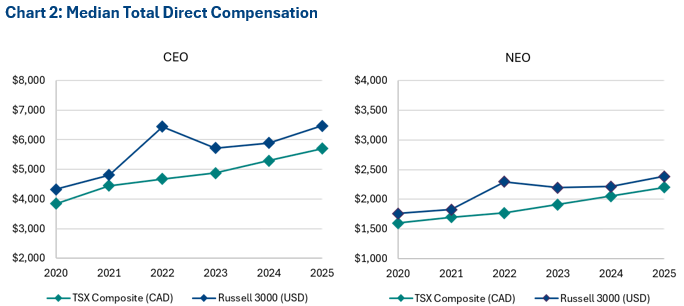
- Among S&P/TSX Composite companies, median total direct compensation (TDC) has increased steadily over the past five years, reflecting annual growth in CEO pay of 8% and NEO pay of 7%
- U.S. executive TDC has increased similarly at 8% annual growth for CEOs and 6% annual growth for NEOs•
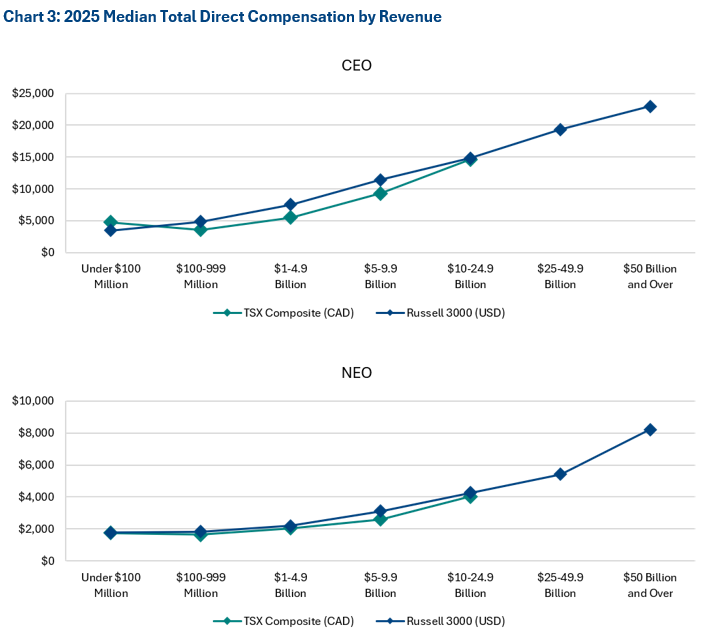
- TDC correlates with company revenue in both markets, similarly in both Canada and the U.S. on an at-par basis
U.S pay premium over Canada
- U.S. executive TDC levels remain higher than those in Canada, with a premium of 15% before accounting for company size and currency
- Accounting for currency, the TDC premium widens to 21%
Drivers of compensation growth
- Salary growth has been outpaced by growth in variable compensation in both Canada and the U.S., particularly long-term incentives (LTI)
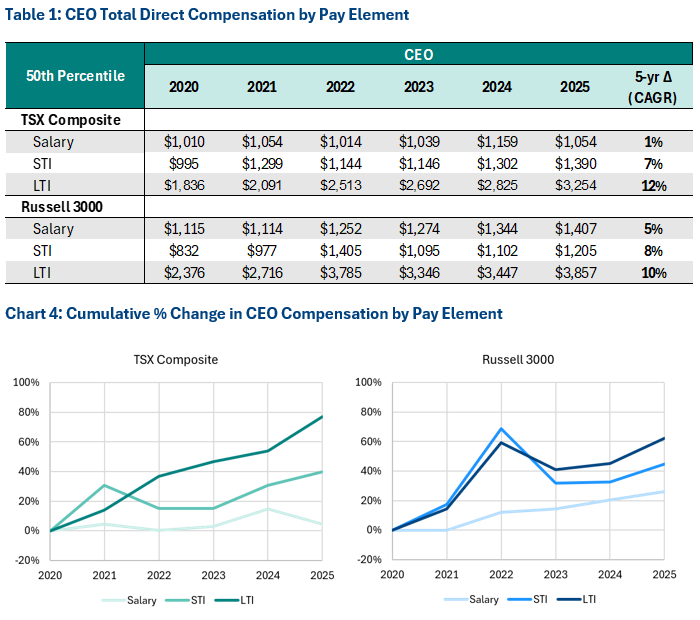
- In Canada, the median CEO salary increased by 1% annually while short-term incentives (STI) and LTI increased by 7% and 12%, respectively. U.S. figures are 5%, 8%, and 10% for salary, STI, and LTI, respectively
Pay mix evolution
- Pay mix has continued to shift towards variable, performance-based compensation in both Canada and the U.S.
- This shift is particularly pronounced among Canadian CEOs, suggesting convergence toward U.S. market practice
LTI vehicles
- The prevalence and average weight of stock options within the LTI mix have continued to decline in both Canada and the U.S.
- For CEOs, option average weight of 32% in 2020 v. 21% in 2025 in Canada and 24% in 2020 v. 15% in 2025 in the U.S.
Introduction
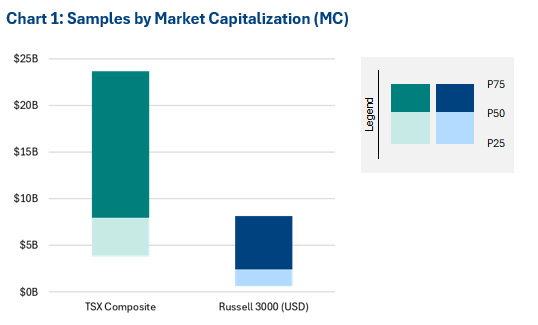
Southlea’s latest research report summarizes executive compensation trends among the companies within the S&P/TSX Composite Index. Data reflect 206 companies that disclosed compensation for their Named Executive Officers (NEOs) and are reported in Canadian dollars ($CAD). Data are also included for the Russell 3000 Index, in U.S. dollars ($USD). The data were collected by ESGAUGE, a data analytics firm. While at the top of the market, U.S. companies are larger than those in Canada, the broader construction of the Russell 3000 introduces a large population of smaller companies.
Methodology
Data in this report reflect compensation disclosed in 2021 to 2026 proxy circulars representing 2020 to 2025 compensation levels, respectively.
Total direct compensation (TDC) is defined as base salary plus actual short-term incentives (STI) plus actual long-term incentives (LTI) and excludes pension, benefits, and all other compensation.
Total Direct Compensation
Median TDC in the S&P/TSX Composite has increased steadily over the past five years, reflecting a compound annual growth rate (CAGR) of 8% for CEOs and 7% for NEOs. The trend in total direct compensation in the U.S. has been similar at 8% for CEOs and 6% for NEOs, except for a sharp increase in 2022 and subsequent correction in 2023, likely owing to a post-pandemic rebound in business performance and labour market pressures.
There also exists a premium in U.S. executive pay levels over Canadian of approximately 15%. This widens when considering differences in company size (refer to Chart 1) and currency of pay information – applying the Bank of Canada’s 2025 average annual exchange rate of $1 USD = $1.3978 CAD increases the pay premium to 21%. For additional considerations related to currency of executive pay, refer to Southlea’s article: Tackling Currency Challenges in Canadian Executive Compensation.
As illustrated by Chart 3 below, there exists a strong relationship between company size and executive compensation – 2025 median total direct compensation rises steadily as company revenue increases for CEOs and NEOs in both Canada and the U.S. On an at par basis (i.e., $1 USD = $1 CAD), pay levels in the two markets are similar within each revenue band, suggesting that the overall pay premium observed in the U.S. reflects differences in the distributions of the two samples.
Drivers of Increases to Total Direct Compensation
Decomposing the increases in total direct compensation by pay element, incentive compensation (particularly LTI) emerges as the primary driver of growth. U.S. CEO salaries have risen 5% on average over the past five years, while short-term and long-term incentives have increased by 8% and 10%, respectively. The divergence is increasingly pronounced in Canada, where salaries were effectively flat at 1% growth on average while STI and LTI increased by 7% and 12%, respectively. Note, however, that this figure reflects the change in median salary in the sample instead of the median salary increase reported by individual companies – between 2024 and 2025, 84% of TSX Composite companies reported an increase to CEO salary, with an average increase of 8.9%.
Pay Mix Evolution
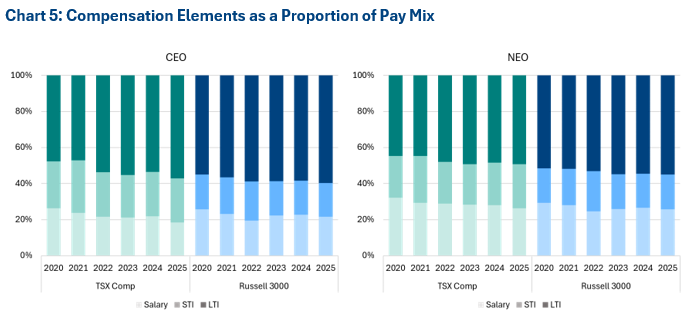
Consistent with the faster growth in incentive compensation relative to salary discussed above, Chart 5 demonstrates a shift in pay mix in both Canada and the U.S. towards variable, performance-based compensation. This reflects investor and governance stakeholder perspectives that executive compensation outcomes should be closely aligned with company performance and the shareholder experience.
This shift is particularly pronounced among Canadian CEOs, indicating a convergence towards U.S. market practice, where incentive compensation has historically comprised a larger share of total pay.
LTI Vehicles
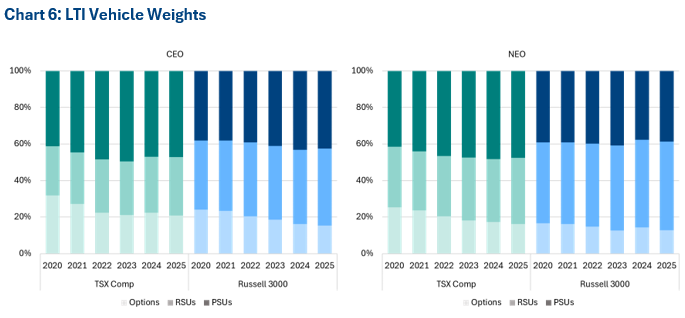
As depicted in Chart 6, the weight on stock options as an LTI vehicle has continued to decline in both Canada and the U.S. – for CEOs, option average weight of 32% in 2020 v. 21% in 2025 in Canada and 24% in 2020 v. 15% in 2025 in the U.S. This shift is consistent with institutional shareholder and governance stakeholder preferences towards full-value, performance-based awards. However, though stock options do not include explicit performance metrics, they can still serve as a performance-oriented vehicle given their longer time horizon, higher risk and leverage, and direct alignment to the shareholder experience.
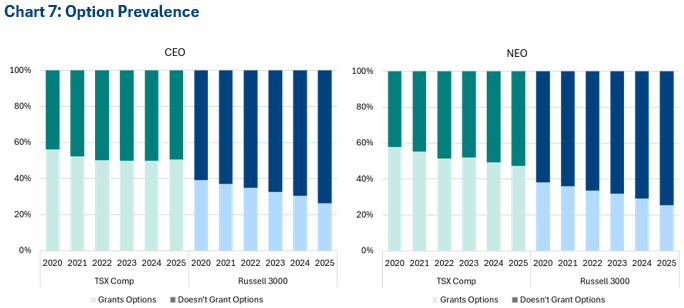
Further to the decreasing average weight on stock options within the LTI mix, the prevalence of option grants has also declined. This may be the primary driver of the overall decrease in option weight, as companies that continue to grant stock options typically maintain a consistent weight within the LTI mix.
About The Authors
Caroline Marshall, Consultant & Christian Lopez, Analyst
Caroline is a Consultant at Southlea Group with five years of experience.
Prior to joining Southlea Group, she worked as an Associate at a large, global multi-service consulting firm, providing analytical support on executive and broad-based compensation projects.
She has experience supporting companies with a variety of compensation-related initiatives, including total rewards philosophy and peer group development, competitive benchmarking of board, executive, and broad-based pay, short- and long-term incentive plan design, and governance of compensation programs.
Caroline has experience working across many sectors, including financial services and Canadian pension plans.
Caroline has an Honours Business Administration degree from Wilfrid Laurier University and an Honours Mathematics degree from the University of Waterloo.
Prior to joining Southlea, Christian held analytical and strategy-focused roles within the financial services, insurance, and healthcare sectors.
He has experience supporting business initiatives through market analysis, process improvement, and strategic planning.
Christian has experience across the financial services, insurance, healthcare, and not-for-profit sectors.