Executive Summary
- We observe a broad range of total board member compensation within the TSX Composite ranging from $125,000 at the 25th percentile to $215,500 at the 75th percentile. There is a clear relationship between company size and compensation
- A “typical” board member receives approximately 55% of their compensation in equity, most as deferred share units (DSUs), and would have to hold 3x their cash retainer in shares
- In addition, board members holding committee or board leadership roles receive additional retainers to reflect their larger workloads and responsibilities. In many cases, Committee Chair retainers are differentiated with higher values provided to Audit and HR/Compensation Committee Chairs
- As we look forward, there are several trends being debated:
- Fee simplification – do we need to continue providing meeting fees and/or retainers for committee members or can we roll into an overall annual retainer?
- Currency – as we broaden our networks to find director talent with the right skills and industry experience, are we increasingly recruiting directors from outside of Canada where we need to be competitive on a North American and/or global basis?
- Form of equity – are we running into any challenges with long-serving directors holding too many DSUs that cannot be liquidated until they leave the board? Should we be considering different approaches to support share ownership while providing greater flexibility?
- Special committees – how should we compensate special committees, particularly when the scope and commitment of these ad hoc committees may not be known until they have concluded their activities?
- Travel fees – do we need to reconsider travel fees as we go back to in-person board meetings where significant travel requirements might need to be made by certain directors?
Introduction
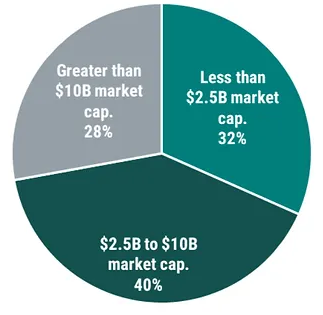
The following report summarizes director compensation trends among the companies within the S&P/TSX Composite Index. The data is from 237 companies that disclosed compensation for their board of directors. All data are in the currency as reported and is summarized on a nominal basis (e.g., $1CAD = $1USD). The data have been summarized by company size in terms of market capitalization, as follows:
Chart 1: Sample by Market Capitalization

Market Compensation Trends
The following reflects compensation disclosed in 2022 proxy circulars representing 2021 compensation levels. Total compensation is estimated based on the number of meetings disclosed by each company (ranging from 6 at the 25th percentile to 11 board meetings at the 75th percentile). Each element is independently arrayed and cannot be added to form the total.
Table 1: Board Member Compensation
Total board member compensation ranges from $125,000 to $215,500 between the 25th and 75th percentiles with $175,000 at the 50th percentile and with approximately 55% provided in equity v. 45% in cash (including the cash retainer and meeting fees where applicable). Less than one quarter of companies continue to provide board meeting fees reflecting a continued trend towards an “all-in” retainer structure.

We continue to see pressures for Canadian companies to remain competitive on a North American / Global basis given the increasing number of board members being recruited from outside of Canada. This also raises questions on the inclusion of US-based peer companies and how to address currency between Canadian and non-Canadian-based directors (e.g., residency-based pay).
Table 3: Board Member Compensation by Size
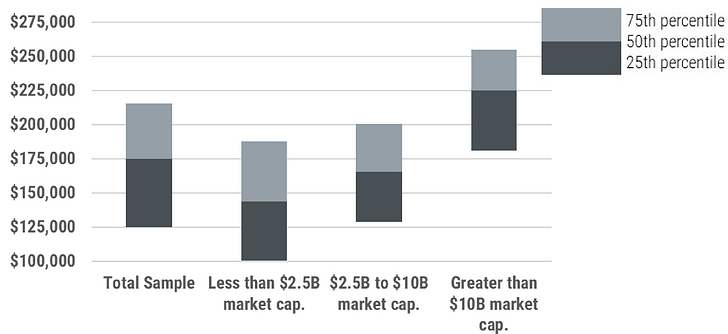
As illustrated in Table 3 and Chart 2, we observe a clear relationship between company size (in terms of market capitalization) and total board member compensation with a broad range of pay within each size category (between $70,000 to $90,000 from the 25th to the 75th percentiles) representing the diversity of practices depending on the organization’s scope, industry, and relative complexity.

Chart 2: Board Member Compensation by Size

Table 4: Board Leadership Compensation
Of the 75% of TSX Composite companies with a non-executive Board Chair, total compensation ranges from $211,200 to $400,000 from the 25th to the 75th percentiles with $300,000 at the 50th percentile. Approximately 30% of TSX Composite companies have a Lead Director with total compensation of $215,000 at the 50th percentile.
When expressed as a multiple of board member compensation, Board Chair’s receive 1.8x board member compensation while Lead Directors receive 1.2x at the 50th percentile.

Table 5: Committee Member Compensation
There is mixed usage of additional compensation (retainers and/or meeting fees) for committee member participation with a slightly higher prevalence for Audit v. other committees. Total committee member compensation at the 50th percentile varies by committee at $10,000 for Audit, $9,000 for Compensation / HR and $7,500 for Nominating / Governance. Where additional compensation is provided, it is generally provided as an additional committee member retainer with less than 20% of these companies providing committee meeting fees.

Table 6: Committee Chair Compensation
Additional compensation (including Committee Chair retainers and meeting fees) for Committee Chairs is more prevalent, particularly for Audit Committee Chairs. Total Committee Chair compensation at the 50th percentile varies by committee at $25,000 for Audit, $20,000 for Compensation / HR and $15,000 for Nominating / Governance representing the respective workloads of each committee.

Board Demographics
TSX Composite companies tend to have between 6 to 11 board members with an average of 31% female board members. About ½ of board members are between 60 to 70 years old and have less than 5 years of tenure. Less than 15% of board members are over 70 years old or have more than 15 years of tenure, likely reflecting a greater focus on board renewal and succession.
Chart 3: Demographics

Board Equity Grants
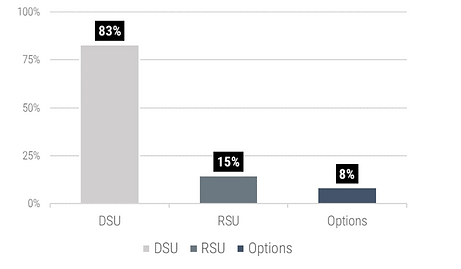
The vast majority of TSX Composite companies continue to grant deferred share units (DSUs) with approximately 15% granting restricted share units (RSUs) and 8% granting stock options, with the use of stock options typically in resource-based and/or recently public companies.
Chart 4: Equity Grants

While DSUs are most common given that you can hold notional shares on a pre-tax basis with tax deferred until a board member retires, there is no flexibility to liquidate prior to retirement which can raise concerns for longer-serving board members particularly in commodity-cyclical businesses. In addition, some investors are raising concerns as to whether DSU ownership is akin to holding real shares. Increasingly, companies are considering different ways of providing equity compensation to support share ownership including:
- Requirements to purchase common shares using a portion of the cash retainers on an after-tax basis allowing any subsequent capital gains/dividends to be taxed accordingly
- Grants of restricted share units which vest and payout over time, of which, a portion of the proceeds can by common shares
Board Ownership Requirements
Almost all TSX Composite companies have share ownership requirements for board members. Most of these requirements are expressed as a multiple of the cash retainer with a 50th percentile of 3.0x; however, some companies use the equity retainer and/or cash + equity retainer when establishing the multiple which can result in significantly different total dollar amounts that need to be held.
Table 7: Share Ownership Multiples

US Market Trends
Working with our GECN Group company in the US, Farient Advisors, we share the following US market trends:
- Modest year-over-year compensation increases (<=3%)
- Continued focus on equity v. cash compensation (60% v. 40%, respectively)
- Fee simplification with only annual retainers provided (inclusive of all meeting fees and committee member retainers)
- Equity primarily in 100% restricted share units
- Increasing use of one-time new director equity grants to support share ownership
Interested in learning more about working with Southlea? Click here
Click to view our consulting service offerings.