Executive Summary
Board member compensation
- Median Canadian Board member compensation increased by 5% in 2025 to $212,542, following increases in each of the prior two years
- Equity represents 59% of total compensation, up from 54% last year reinforcing the market emphasis on longer-term shareholder alignment
- The U.S. pay premium continues to narrow but still exists primarily driven by higher equity retainers (v. cash compensation) creating competitive challenges when recruiting across North America
Industry differentials
- Board member compensation is highest in the Energy & Utilities and Information Technology & Communications sectors (~10% higher than on average) and lowest in the Financials and Health Care sectors (~13% lower than on average). Industry context therefore remains important when selecting peers and interpreting market positioning
Board chair compensation
- Median Board Chair compensation increased by 3% in 2025 to $345,000, from $335,000 in 2024
- Approximately a 1.6x multiple between Board Chair compensation and Board member compensation, consistent year over year
Committee compensation
- Committee member retainers have converged at a median of $10,000 across the Audit, Compensation / HR, and Nominating / Governance committees, continuing the shift toward simpler, undifferentiated member pay
- Committee Chair compensation remains more prevalent and differentiated reflecting different workloads amongst the Chairs
Pay design
- Equity continues to be delivered predominantly through deferred share units, although some Canadian companies are exploring restricted share units as a more flexible alternative
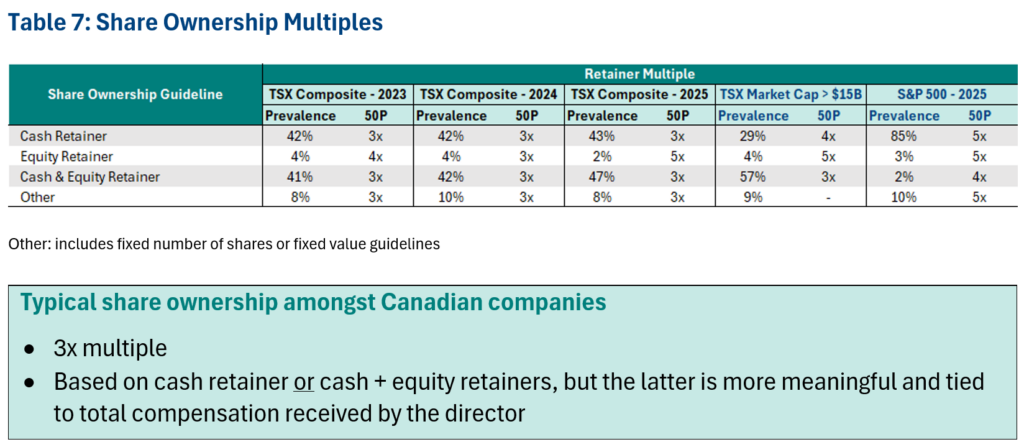
- Share ownership requirements remain 3x either the cash retainer or the total cash plus equity retainer. Because these definitions produce materially different ownership expectations, Boards should assess whether their guideline is tied to the most meaningful measure of total compensation
Demographics
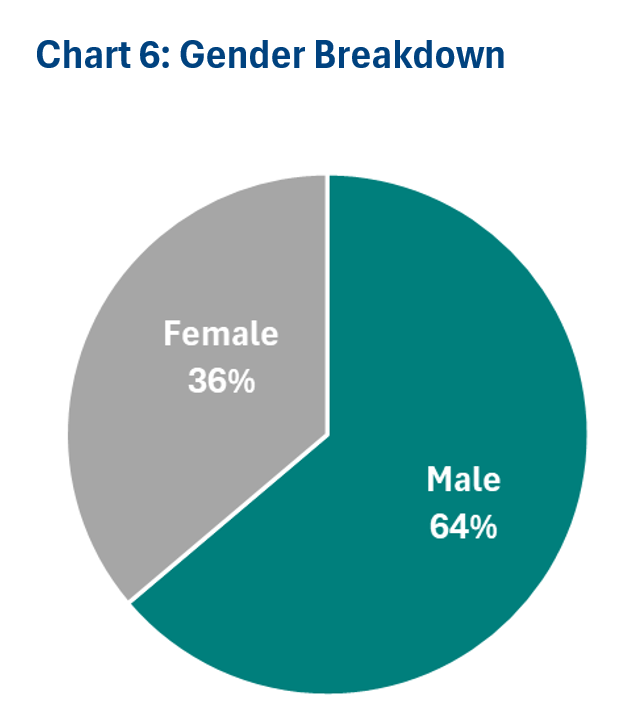
- Women represent 36% of TSX Composite directors, unchanged from 2024, indicating that progress in gender representation has stalled
- Board members similar age, though more tenured than in 2024. Boards may wish to consider whether renewal and succession practices are keeping pace with evolving skill requirements
- International representation is now common: 85% of TSX Composite companies have at least one director based outside Canada, and 34% of directors reside internationally, with the prevalence of Canadian-dollar-denominated pay declining as the number of foreign directors increases. Access to specialized global talent can strengthen Board composition, but may also add currency, recruitment, and compensation complexity
Introduction
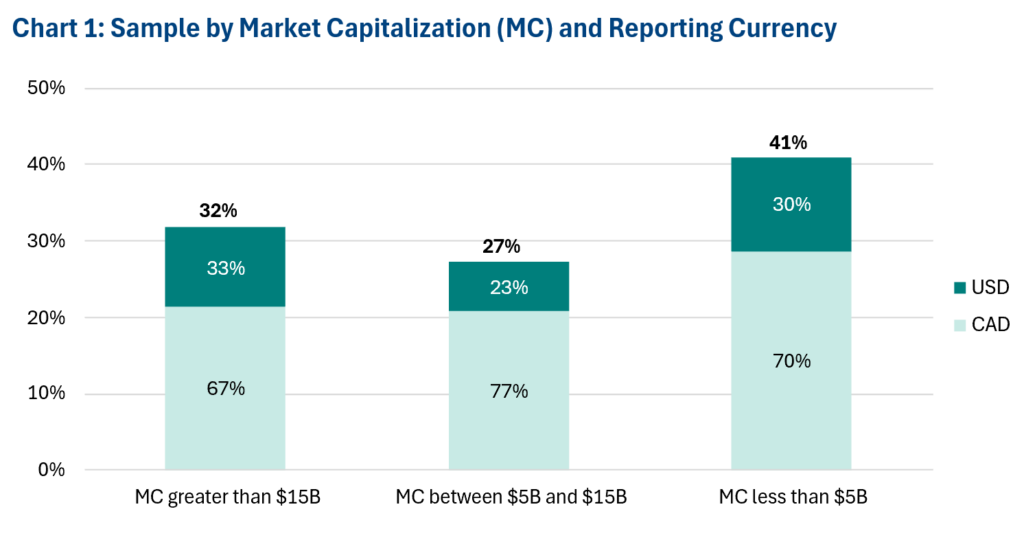
Southlea’s latest research report summarizes year-over-year director compensation trends among companies in the S&P/TSX Composite Index. The analysis includes 220 companies that disclosed compensation for their Boards of directors, with results summarized by company size based on market capitalization (MC) in Canadian dollars (CAD). To reflect overall market growth, this year’s report uses updated size categories: the largest company category now includes companies with an MC greater than $15 billion v. $10 billion last year, while the smallest company category includes companies with an MC below $5 billion v. $2.5 billion. Data were collected by ESGAUGE, a data analytics firm.
Methodology
Data in this report reflect compensation disclosed in 2024, 2025, and 2026 proxy circulars, representing 2023, 2024, and 2025 compensation levels, respectively. Total compensation is estimated using a standard number of meetings and committee memberships – eight Board meetings, two committee memberships, and four meetings per committee – to provide an apples-to-apples comparison of similar workloads. All data are shown in the currency reported by each company and summarized at par (e.g., $1 CAD = $1 USD). New this year, data are also presented in a consistent currency (CAD). For comparison, the report includes S&P 500 data in USD and data for TSX Composite companies with a market capitalization greater than $15 billion, providing a size-adjusted comparison with the S&P 500 (median market capitalizations of $41 billion CAD and $45 billion USD, respectively). Each compensation element is independently arrayed and therefore cannot be added to calculate total compensation.
Board Member Compensation
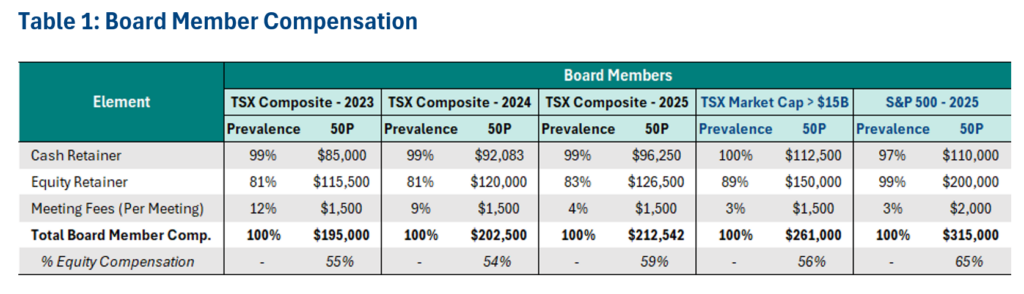
Median total Board member compensation for the TSX Composite increased from $195,000 in 2023 to $202,500 in 2024 and $212,542 in 2025.
Equity compensation now represents 59% of total compensation, up from 54% in 2024 (cash compensation includes the cash retainer and meeting fees, where applicable).
In 2025, median total Board member compensation for the S&P 500 was $315,000 USD, 21% higher than for the similarly sized TSX Composite >$15 billion sample, excluding the impact of currency.
The difference between U.S. and Canadian cash compensation is comparatively modest, with significantly higher equity retainers driving most of the gap in total Board member compensation.
Companies continue to move away from Board meeting fees. Only 4% of companies retain this practice, down from 9% last year and 12% in 2023, reflecting the continued shift toward an “all-in” retainer structure.
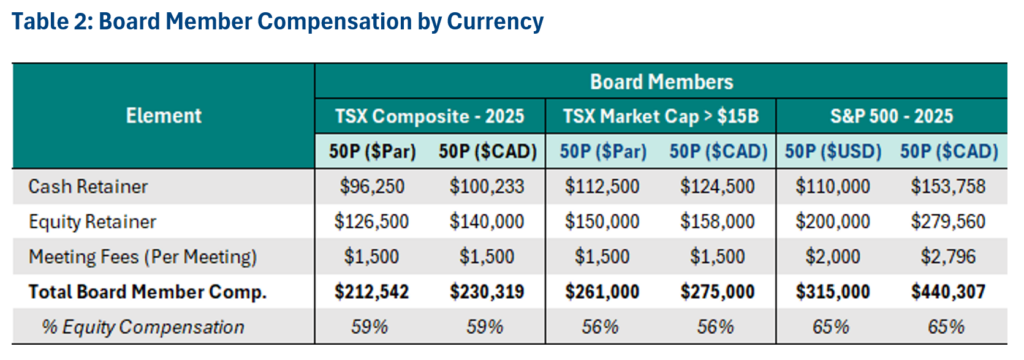
New this year, data are presented both at par and converted to a consistent currency (CAD) for those companies that pay their directors in USD. On a currency-adjusted basis, median total Board member compensation for the TSX Composite is $230,319 CAD, approximately 8% higher than the at-par value of $212,542.
For TSX Composite companies with a market capitalization greater than $15 billion, median total compensation is $275,000 CAD, approximately 5% higher than the at-par value of $261,000.
Compared with the currency-adjusted TSX Composite >$15 billion sample, median S&P 500 Board member compensation of $315,000 USD when converted to $440,307 CAD is approximately 60% higher. This indicates that the relative strength of the U.S. dollar materially widens the reported pay difference; however, higher underlying compensation also contributes to the U.S. pay premium.
Board Member Compensation by Company Size
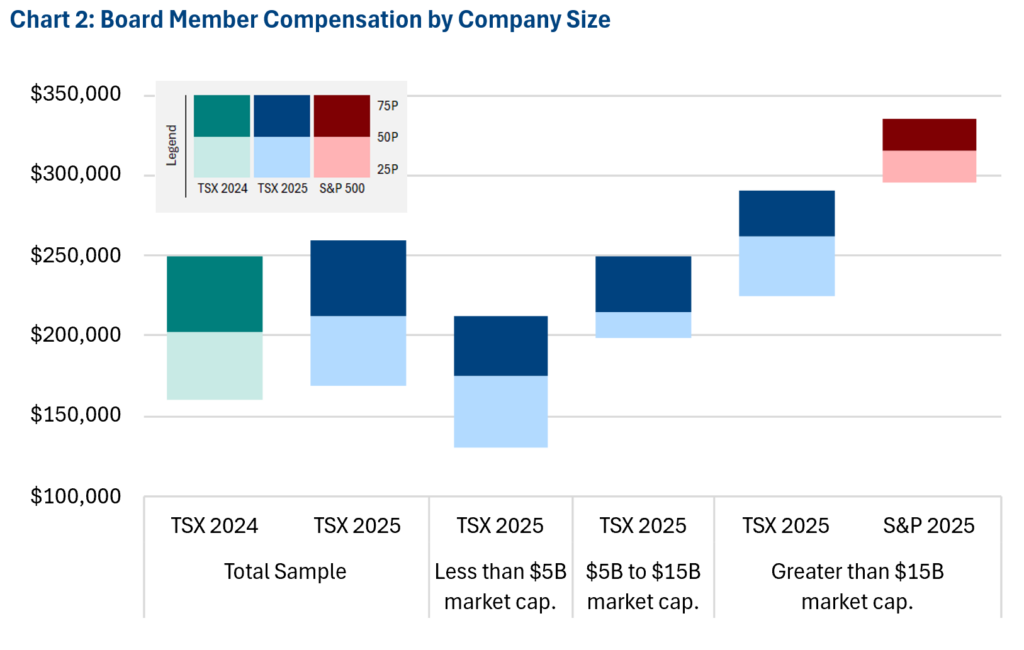
There is a clear relationship between company size, measured by market capitalization, and total Board member compensation. The range of compensation among similarly sized companies reflects differences in organizational scope, industry, and complexity.
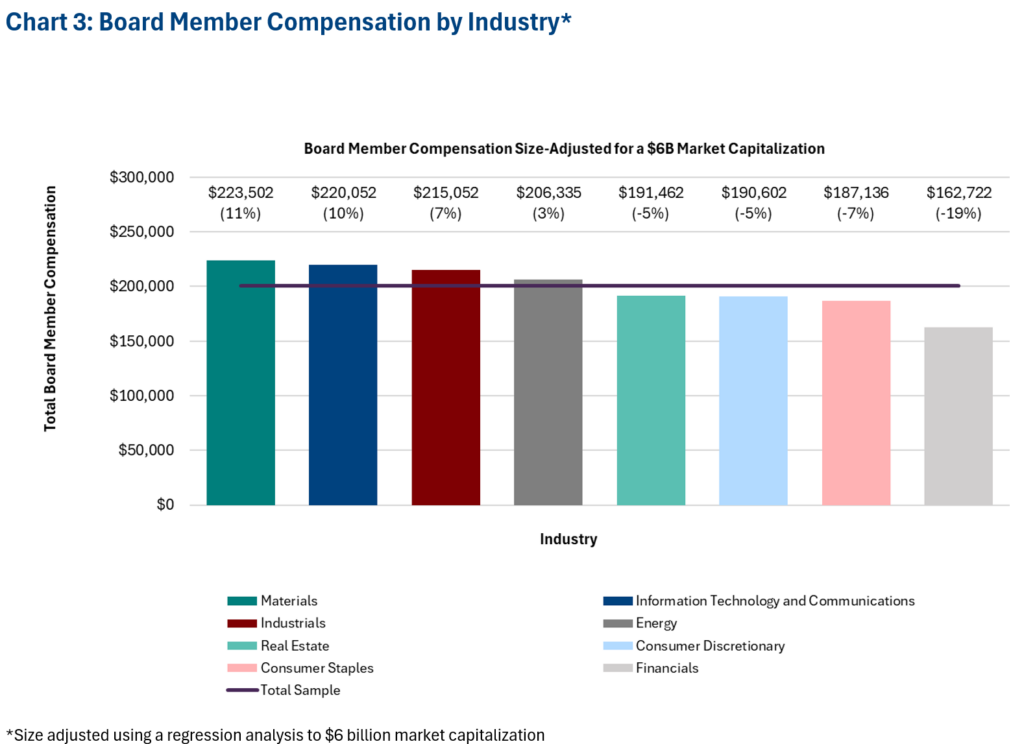
Board Member Compensation by Industry
Board member compensation is highest in the Energy & Utilities and Information Technology & Communications sectors and lowest in the Financials and Health Care sectors. This analysis has been normalized to a company with a market capitalization of $6 billion to isolate the effect of industry on compensation. Differences by industry may reflect the relevant talent market: some sectors draw from a broader global pool or require specialized skills and experience, which can place upward pressure on compensation.
Board Chair Compensation
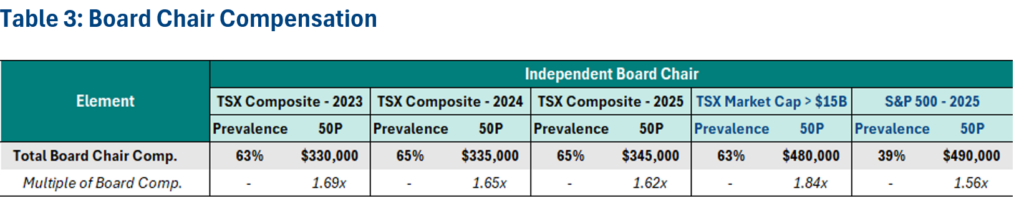
Among the 65% of TSX Composite companies with a non-executive Board Chair, median total Board Chair compensation increased by 3%, from $335,000 to $345,000. At the median, Board Chairs receive 1.6x Board member compensation, consistent with the past two years. Median independent Board Chair compensation among TSX Composite companies with a market capitalization greater than $15 billion is significantly higher, at $480,000, with greater differentiation from typical Board member compensation (1.8x).
In the U.S., approximately 40% of S&P 500 companies have a non-executive Board Chair, reflecting the greater prevalence of a combined Board Chair and CEO role. At $490,000, median non-executive Board Chair compensation is 2% higher than in the similarly sized Canadian sample, which is significantly narrower than the 21% premium observed for Board members. Consistent with this result, U.S. Board Chair compensation represents a lower multiple of Board member compensation (1.6x, compared with 1.8x in the similarly sized Canadian sample).
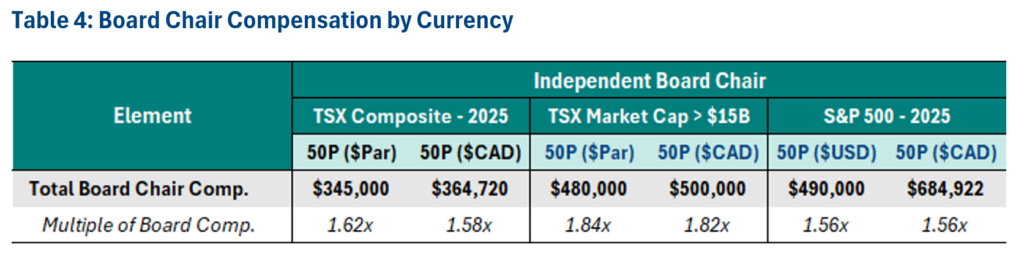
New for this year, Board Chair compensation is also presented on a currency-adjusted basis. Converting compensation to Canadian dollars increases median Board Chair compensation by approximately 6% for the TSX Composite, from $345,000 to $364,720, and by approximately 4% for companies with a market capitalization greater than $15 billion, from $480,000 to $500,000.
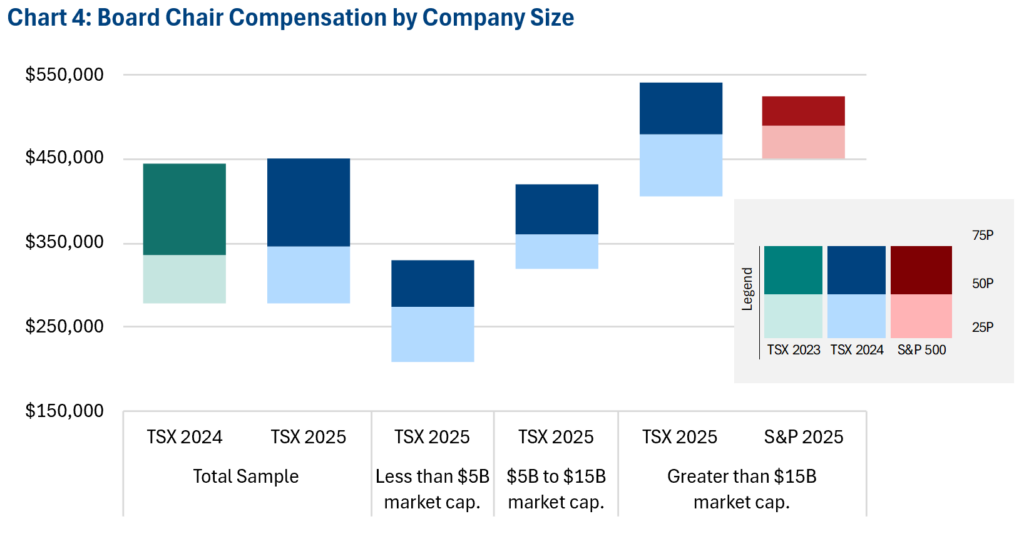
Similar to Board member compensation, Board Chair compensation is strongly influenced by company size, increasing steadily as market capitalization increases. As noted above, compensation among TSX Composite companies with a market capitalization greater than $15 billion is broadly aligned with the S&P 500, suggesting that company size is an important consideration when comparing Canadian and U.S. pay levels.
Committee Compensation
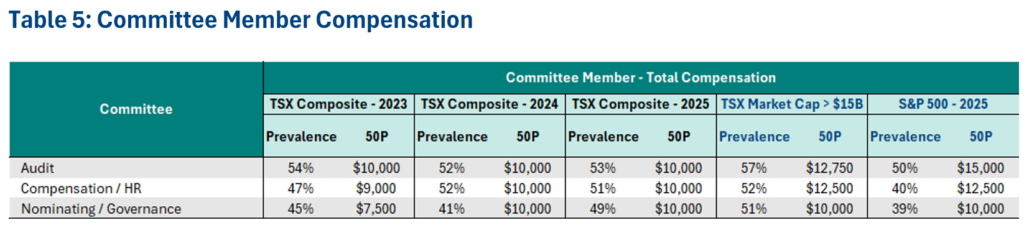
The use of additional compensation (retainers and/or meeting fees) for committee participation varies. Median committee member compensation is $10,000 for each of the Audit, Compensation / HR, and Nominating / Governance committees, continuing the trend toward undifferentiated committee compensation observed last year (compared with 2023 values of $10,000, $9,000, and $7,500, respectively). Committee member compensation in Canada remains lower than in the S&P 500.
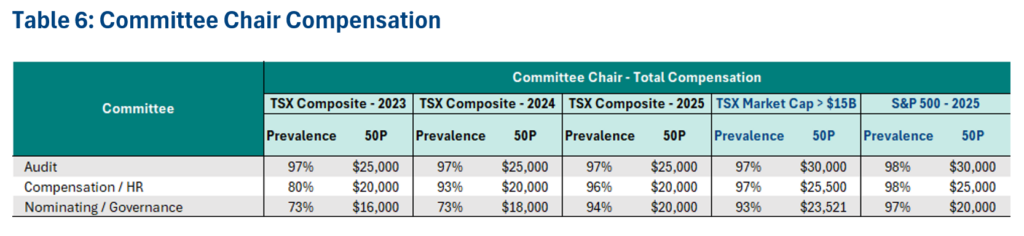
Additional compensation for Committee Chairs, including retainers and meeting fees, is more prevalent than for Committee members. Following last year’s increase in the prevalence of Compensation / HR Committee Chair fees from 80% to 93%, the prevalence of Nominating / Governance Committee Chair fees increased from 73% to 94% this year. Median compensation varies by committee, at $25,000 for Audit Committee Chairs and $20,000 for both Compensation / HR and Nominating / Governance Committee Chairs, reflecting differences in committee workloads. Committee Chair compensation remained relatively consistent year over year, except for an 11% increase for Nominating / Governance Committee Chairs. Pay levels among TSX Composite companies with a market capitalization greater than $15 billion are broadly aligned with, or slightly higher than, those in the S&P 500.
Board Equity Grants
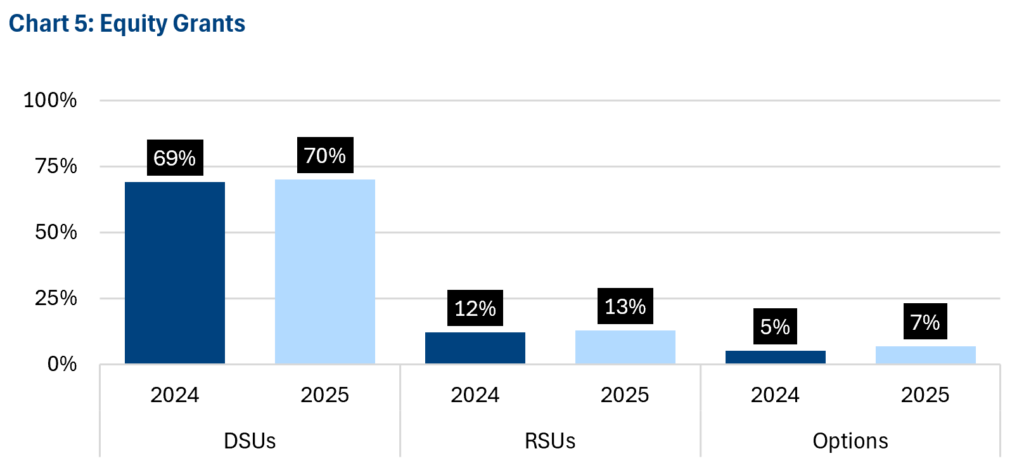
Most TSX Composite companies continue to grant deferred share units (DSUs), while approximately 13% grant restricted share units (RSUs) and 7% grant stock options, with little change year over year. Stock options are most common among resource-based and/or recently public companies. In the U.S., S&P 500 companies primarily grant equity in the form of RSUs.
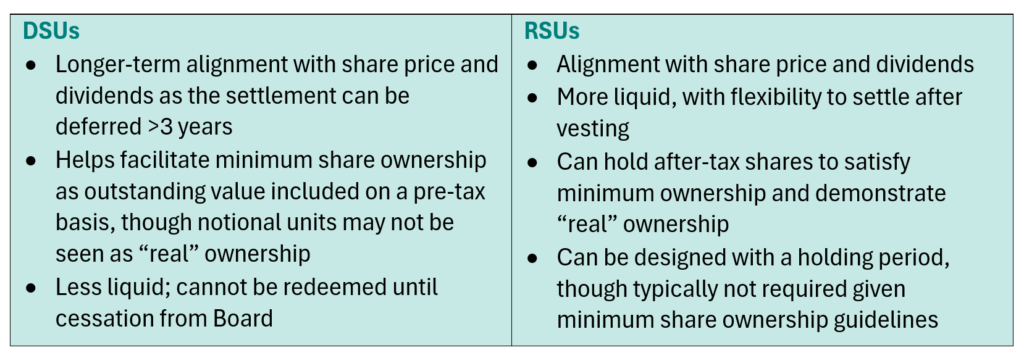
While DSUs and RSUs both create alignment to share price and dividends, they differ in settlement timing, liquidity, and how they support share ownership requirements. Some Canadian companies are therefore exploring the use of RSUs as a more flexible alternative to DSUs. The following considerations can help companies assess the relative appropriateness of each vehicle.
Share Ownership Requirements
Share ownership requirements are generally unchanged year over year. Almost all TSX Composite companies articulate requirements for Board members as a multiple of either the cash retainer or the combined cash and equity retainers. Despite the substantially different dollar values resulting from these definitions, the median requirement is 3.0x under both approaches.
Governance influencers, including the Canadian Coalition for Good Governance in 2022 and The Globe and Mail’s Board Games in 2024 have expressed a preference for defining executive share ownership as a multiple of total direct compensation rather than salary, analogous to using total retainer rather than cash retainer for directors.
Although adoption of policies aligned with this approach has been limited, organizations may wish to re-evaluate their executive and Board member share ownership guidelines against evolving governance practices.
In the U.S., most S&P 500 companies express the requirement as a multiple of the cash retainer. The median requirement is also higher, at 5x the retainer compared with 3x in Canada; however, it is applied to a relatively smaller cash component, whereas more than 40% of Canadian companies apply the requirement to the combined cash and equity retainers.
Board Demographics
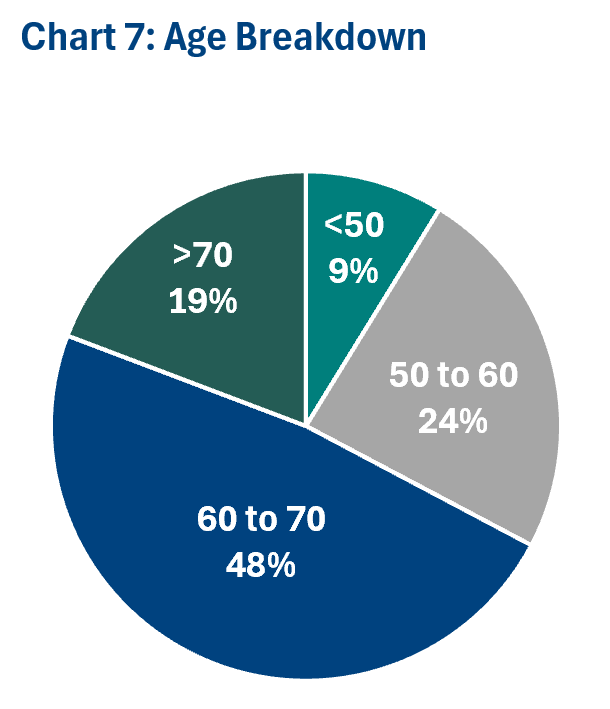
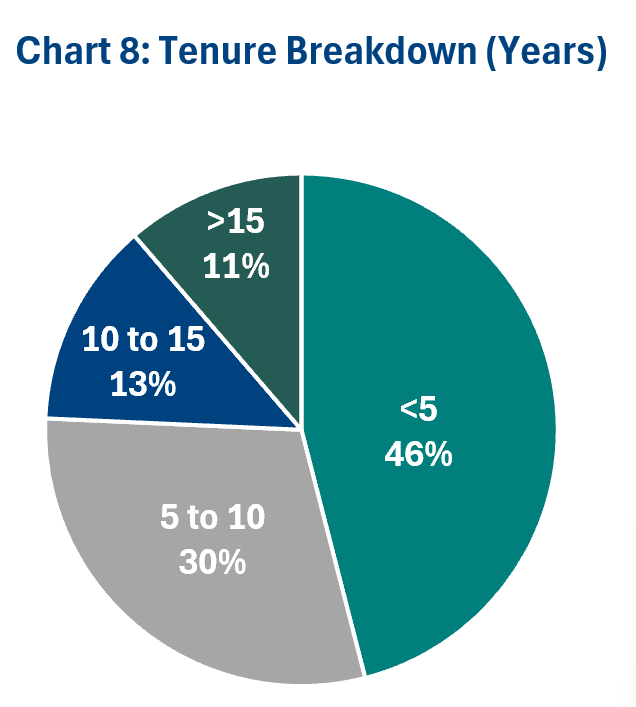
TSX Composite companies generally have between 7 and 13 Board members, with women representing an average of 36% of Board members, consistent with last year. By age, 33% of Board members are younger than 60, down from 36% last year, while approximately half are between 60 and 70. Board member tenure increased year over year: the proportion serving for less than five years declined to 46% from 50%, while the proportion serving for more than 10 years increased to 24% from 23%.
Highlights
- 36% female board members (consistent with last year)
- Average age of 62.4 years (v. 62.5 years last year)
- Average tenure of 7.4 years (v. 6.8 years last year)
Board Residence
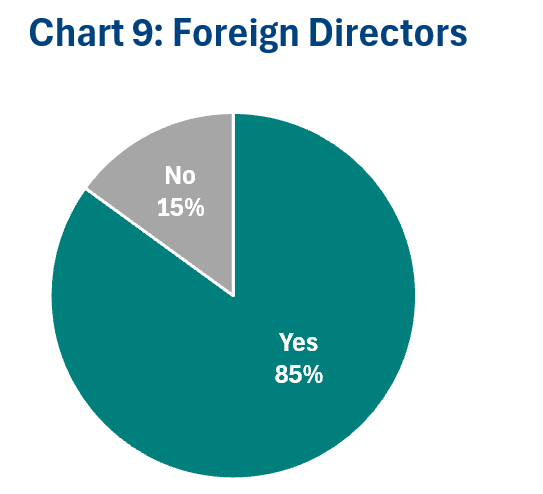
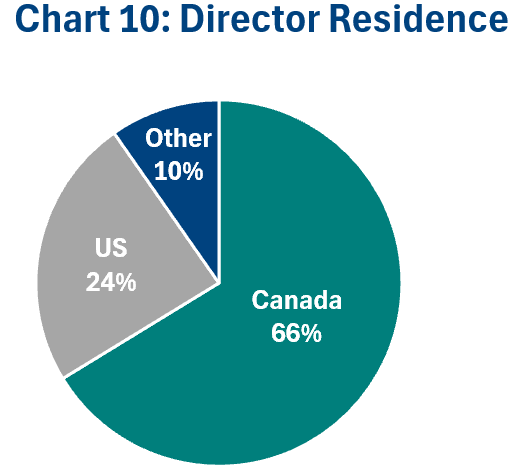
The majority (85%) of TSX Composite companies have at least one director based outside Canada. Overall, 66% of directors reside in Canada, 24% in the U.S., and 10% in other countries (most commonly the United Kingdom, China, and Australia).
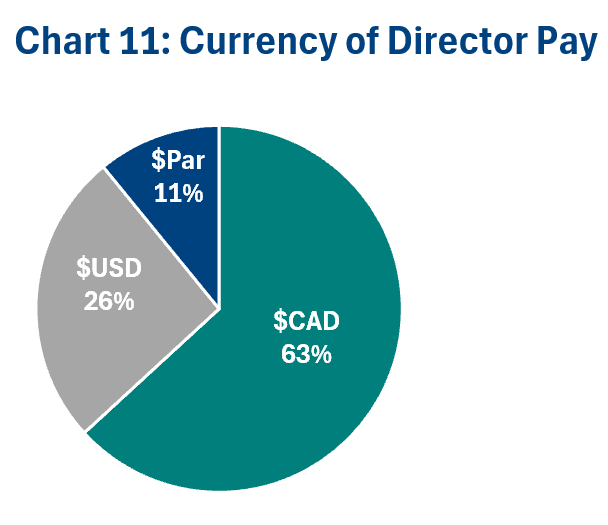
Board compensation is most commonly denominated in Canadian dollars (63%), followed by U.S. dollars. A minority of companies use a par approach (i.e., $1 USD = $1 CAD), with the applicable currency determined by director residence. When assessing only the companies with at least 1 foreign director, the proportion of companies denominating pay in $CAD is 57%, with this proportion declining further to 53% for companies with at least 2 foreign directors.
Canadian companies should carefully assess whether international recruitment is necessary to access specialized skills and experience not readily available in Canada, as it can add complexity and place upward pressure on director pay.
Highlights
- 85% of companies have at least 1 director residing outside of Canada
- Approximately one third of directors are based outside of Canada
- Most TSX Composite companies denominate Board pay in Canadian dollars
About The Authors
Caroline Marshall, Consultant
Caroline is a Consultant at Southlea Group with five years of experience.
Prior to joining Southlea Group, she worked as an Associate at a large, global multi-service consulting firm, providing analytical support on executive and broad-based compensation projects.
She has experience supporting companies with a variety of compensation-related initiatives, including total rewards philosophy and peer group development, competitive benchmarking of board, executive, and broad-based pay, short- and long-term incentive plan design, and governance of compensation programs.
Caroline has experience working across many sectors, including financial services and Canadian pension plans.
Caroline has an Honours Business Administration degree from Wilfrid Laurier University and an Honours Mathematics degree from the University of Waterloo.